Pine Mountain Settlement School
Series 13: Education
Series 09: Biography – Glyn Morris, Director
GLYN MORRIS STUDY & RECOMMENDATIONS X APPENDIX
TAGS: Glyn Morris Study & Recommendations X Appendix; Glyn Morris; Directors; Pine Mountain Settlement School; Harlan County, KY; education; educational study; planning; institutional reports; institutional management; educational recommendations; 1942; institutional history; maps; charts; graphs; high school youth; student regional distribution; 1931-1941 data; appendices; “Educational temperature”; application forms; financial comparisons.
GALLERY: Glyn Morris Study & Recommendations X Appendix
-

- APPENDIX divider page. morris_study_x_appendix (1)
-
- APPENDIX-“Distribution of HIgh School Youth”” morris_study_x_appendix (2)
-

- APPENDIX- MAP “Distribution of High School Youth” morris_study_x_appendix (3)
-
- APPENDIX- MAP “Distribution of High School Youth” morris_study_x_appendix (4)
-
- APPENDIX-MAP “Distribution of High School Youth” morris_study_x_appendix (5)
-
- APPENDIX 3. “Some Data on PMSS Students 1931-1941 morris_study_x_appendix (7)
-
- APPENDIX 3. “Some Data on PMSS Students 1931-1941. morris_study_x_appendix (6)
-
- APPENDIX 4. “Student Application Blank” morris_study_x_appendix (8)
-
- APPENDIX 5. “Study of Staff Turnover 1931-1941.” morris_study_x_appendix (9)
-
- APPENDIX 5. “Study of Staff Turnover 1931-1941.” morris_study_x_appendix (10)
-
- APPENDIX 6 “Educational Temperatures of PMSS.” morris_study_x_appendix (11)
-
- APPENDIX 6 “Educational Temperatures of PMSS.” morris_study_x_appendix (12)
-

- APPENDIX 6 “Educational Temperatures of PMSS.”morris_study_x_appendix (13)
-
- APPENDIX 6 “Educational Temperatures of PMSS.”morris_study_x_appendix (14)
-
- APPENDIX 7 for p. 25. Financial comparisons” morris_study_x_appendix (15)
TRANSCRIPTION: Glyn Morris Study & Recommendations X Appendix
[Text is typewritten unless otherwise indicated.]
[morris_study_x_appendix-1.jpg – Divider page.]
A P P E N D I X
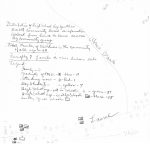
[morris_study_x_appendix-2.jpg – Handwritten notes and sketch of map.]
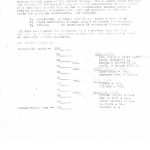
Distribution of High School Age Youth in Pine Mt. Community based on information gathered from house to house canvas by Community Group.
—————————-
Total Number of Children in the community of all ages – 611
————————-
Roughly 7 families to this linear mile.
————————-
Legend:
Family – O
Graduate of P.M.S.S. – * blue – 11
Attending now – * red – 1
Day Students – yellow – 7
High School age – not in school – * – green – 51
High School age – in other schools [symbol] black – 15
County grade school [symbol]
——————————
[Pencil sketch of map showing Laurel, Abner’s Branch.]
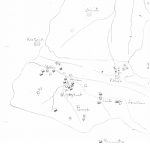
[morris_study_x_appendix-3.jpg]
[Pencil sketch of map with symbols, showing Big Laurel, Greasy, Little Laurel, and PMSS.]
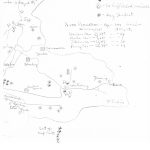
[morris_study_x_appendix-4.jpg]
[Pencil sketch of map with symbols, showing Red Bird, Wallins, Harlan, P.M.S.S., Greys Knob, Cawood, Everts, Louellen, Pennington, Stinnit (?) and Hyden.]
[morris_study_x_appendix-5.jpg]
Legend:
[symbol] – Private School
[symbol] – Public School
[symbol] – Normal home
[symbol] – Broken home
[symbol] – No high school available
[symbol] – Day student
YOUTH POPULATION – Age 1 -19 inclusive
U.S. Census 1940 at Pine Mt.
Harlan Co. – 37,248 – 34
Leslie Co. – 8,616 – 1
Letcher Co. – 21,617 – 24
Perry Co. – 25,740 – 14
[Pencil sketch of map with symbols, showing Blue Diamond, Hazard, Jeff, Viper, Vicco, Carcosione, Gander, Delphia, Blackey, Kingdom Come, Whitesburg, Fleming, McRoberts, Cumberland, Benhow(?), Lynch, Jenkins, and others.]
Out of map limits [symbols]
[morris_study_x_appendix-6.jpg]
Some data on Pine Mountain Students (cont.)
Intelligence quotients:
Below normal – 55 to 85 Number – 78
Normal – 85-115 “ – 220
Above Normal – Above 115 “ – 13
Unknown – 170
(Intelligence tests not given to all students 1931-1935)
Explanation: Tests used over this period were the Binet Scale, Otis, and Kuhlman Anderson.
We have allowed five points in the students’ favor because of the known language handicap of the area.
Official dismissals — 48
Explanation: A student whose schooling has been broken either in the middle or at the end of a term by faculty or Student Government decree. Most of the above dismissals were the result of action taken by the Citizenship Committee.
Number living in Coal Camps — 195
Explanation: The homes that are under direct influence of the mining camp atmosphere and culture, whether directly in or on the outskirts of a mining town.
Number living in rural homes — 212
Explanation: The isolated farm home, dependent either on lumbering or farming for sources of income. Includes also those where the head of the family may work at a mine but live a considerable distance away in a rural atmosphere.
Number living in towns — 74
Explanation: Harlan, Pineville, Whitesburg, Cumberland, Jenkins, Hazard or suburbs.
Number who live in Harlan County — 290
Number of Graduates — 123
[morris_study_x_appendix-7.jpg]
[Handwritten notation, upper right] “Appendix 3”
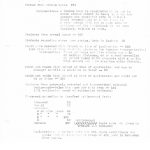
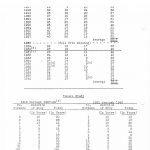
Some Data on Pine Mountain Students 1931-1941
Total number of students who have attended Pine Mountain one semester or longer — 481
Boys — 216
Girls — 265
Number from broken homes 211
Explanation: A broken home is considered to be one in which either parent is dead; in which the parents are separated with or without legal proceedings; in which there is a step-parent with two or more sets of children and the individual is not particularly welcome at home.
Students from normal homes — 248
Students regarding whose home status, data is lacking 22
Could have reached High School at the time of application — 233
(See also map of Pine Mountain students for further interpretation)
Explanation: Those students who live within one mile of walking distance, or on a road travelled by school buses which connects with a public high school not more than ten miles distant.
Could not reach High School at time of application but due to changed conditions could do so later — 80
Could not reach High School at time of application and could not do so later — 156
Students from extremely retarded and impoverished cultural background — below the norm for this area — 144
(All estimation based on subjective evidence.)
Placement according to Stanford Achievement Test:
Advanced 13
Normal 83
Retarded
4 or more years 44
3 “ “ “ “ “ “ “ “ “ “ “ 78
2 “ “ “ “ “ “ “ “ “ “ “ 106
1 “ “ “ “ “ “ “ “ “ “ “ 50
Unknown 107 (Achievement Tests were not given in 1931-32 and 1932-33.)
Explanation: A student with his 8th grade certificate who comes with an educational level of 4th years is retarded four years.
[morris_study_x_appendix-8.jpg]
[Handwritten notation, upper right] “Appendix 4”
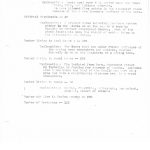
STUDENT APPLICATION BLANK
Pine Mountain Settlement School, Pine Mountain, Harlan Co., Kentucky
Name______________________________________________
(Write Carefully in applicant’s own handwriting)
Where were you born? Town__________County________State_____
Date of Birth, Month______________Day_____________Year_________
At what Post Office do you get your mail?_______________
Give directions for getting to your home from Pine Mt.______
__________________________________________________
Have you stayed out of school any year?________How long?____When_________
Where did you go to school last?_____________County________
When did you go there?________________Date________Is it a High School_________________________
How far away from the nearest High School do you live?________
Where is the nearest high school?__________________________
How would you get there (underline) 1. Train 2. Taxi 3. Bus 4. Walk
What grade are you ready to enter?________________________
What grades have you repeated? _____________ Skipped?_______
Are your parents living?__________________If not, explain
Father’s name__________________________Mother’s name____________________
Do you have a guardian?__________Name_______________
What does your father or guardian do?___________________
What does your mother do?____________________________
Give the names of three people, not in your family, who can tell us something about you:
Name_____________County_________Town________State____
Name_____________County_________Town________State____
Name_____________County_________Town________State____
Why do you want to come to Pine Mountain?____________________________________________
Date this application was filled out_________________________
[morris_study_x_appendix-9.jpg]
[Handwritten notation, upper right] “Appendix 5 (Personnel)”
– 24 –
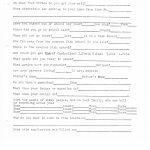
Study of Staff Turnover
1913 through 1941
[Table of statistics consisting of 4 columns: Year, Total No. on Staff, Employed Previous Year Employed for First Time, Per Cent of Staff That is New]
Tenure Study
[Table of statistics consisting of 6 columns:
1913 through 1927-28 (f) – No. Workers, Duration of Stay (In Years), Total (In Years)
1931 through 1940 – – No. Workers, Duration of Stay (In Years), Total (In Years)
[morris_study_x_appendix-10.jpg]
[Continuation of above table.]
Average tenure for year 1939-40, 4.4 years
Average tenure for year 1940-41, 4.1 years
———————————————————————————
- Source: Pine Mountain History
- Director this year, Mr. Hadley
- Director, beginning this year, Mr. Morris.
- Includes student assistants.
- Includes newly created position
- Source: Tenure Study by Miss Wells, Pine Mountain History.
[morris_study_x_appendix-11.jpg]
[Handwritten notation, upper right] “Appendix 6”
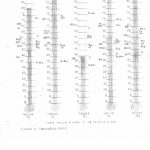
EDUCATIONAL TEMPERATURES OF PINE MOUNTAIN SCHOOL
By
Cooperative Study of Secondary School Standards
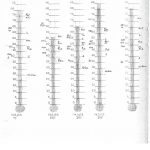
These thermometers show the relative standing of Pine Mountain on a large number of significant factors in nine important fields: Curriculum, Activities, Library, Guidance, Instruction, Outcomes, Staff, Plant, and Administration. Norms for evaluation are based upon detailed evaluations made by the Cooperative Study, during the school year 1936-37, of 200 carefully selected secondary schools located in all parts of the United States. These thermometers exhibit the results of 300 [500?] evaluations, and other measurements of the quality of a secondary school in a series of thermometer scales, several related evaluations usually being groups together to form the basis for a single thermometer. For example:
- Curriculum — based upon 15 component thermometers
- Pupil activities — based upon 3 component thermometers
- Library — based upon 14 component thermometers
All data was checked and evaluated by a three-day stay at Pine Mountain by a visiting committee representing the Cooperative Study of Secondary School Standards.
KEY TO THERMOMETERS:
Percentile Scale — 100____
95____
90____ V.L.
85____ Acc.
80____
75____ Pvt.
70____
65____M.S.
60____
55____
Country-wide Norm — 50____
SITE NORMS
Very Large — (over 1,000) V.L.
Large — (500-999) L.
Medium — (200-499) M.
Small — (under 200) S.
ACCREDITATION NORMS
Accredited — Acc.
Non-accredited — N.Acc.
TYPE NORMS
Public — Pub.
Private — Pvt.
REGIONAL NORMS
Middle States — M.S.
New England — N.E.
North Central– N.C.
Southern — So.
Western — W.
[morris_study_x_appendix-12.jpg]
Educational Program
[5 columns of statistics with handwritten notations. Headers: Curriculum (200), Activities (200), Library (200), Guidance (200), Instruction (200).]
Total Weight — Educational Program — 50%
(Based on incomplete data.)
[morris_study_x_appendix-13.jpg]
[5 columns of statistics with handwritten notations. Headers: Outcomes (200), Staff (200), Plant (200), Administration (200), GRAND TOTAL (200).]
[morris_study_x_appendix-14.jpg]
[This image is a duplicate of morris_study_x_appendix-13.jpg.]
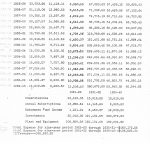
[morris_study_x_appendix-15.jpg]
25 –
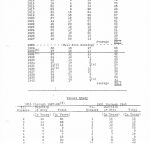
COMPARISON OF FIGURES FOR YEARS 1921-22 THROUGH 1939-40
[7 columns of figures, with these headers: Years, Contributions, Annual Subscriptions, Endowment Fund Income, Investments, Total Expense, Total Revenue.]
See Also:
GLYN MORRIS Biography
GLYN MORRIS STUDY & RECOMMENDATIONS [FOR PMSS] 1942